
CL Research Implementation of Minnesota Contextual Content Analysis
E-Score: Selected Plots
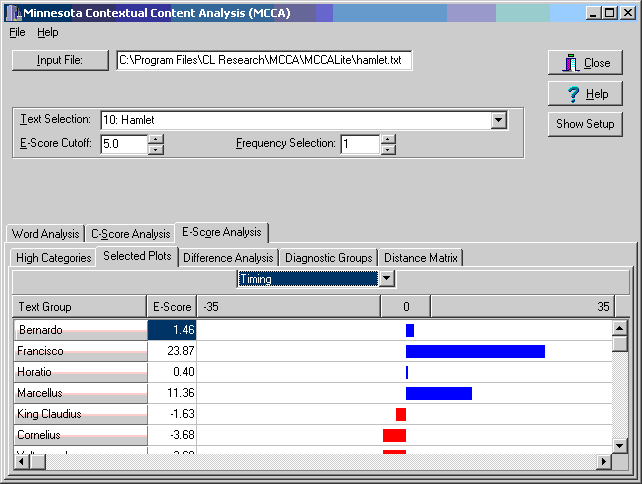
Plots of emphasis scores (E-scores) for those categories for which either an E-score for one of
the text groups has an absolute value greater than 5.0 or the difference between the E-scores for any two of
the text groups is greater than 5.0. These plots consist of arrows from a zero-point to an approximate plus
or minus point corresponding to the E-score for the category, allowing the E-scores from different texts to
be compared.
Maintained by Ken Litkowski.
© 1994-2020 CL Research
Modified: Aug 03, 2020